Expand your business horizons
Improve every aspect of your portfolio's revenue
Pricing Strategies
Create the proper context to inform the most precise
pricing strategy possible
Listing Acquisition
Become more precise & personalized in your owner outreach by deeply understanding their performance
Listing Merchandising
Combine amenity & performance data to isolate which listings with highly effective merchandising.
Owner Retention
Drive exceptional retention through precise, personalized owner comms
Fees & Stay Restrictions
Analyze stay patterns & cleaning fees to understand how these decisions impact revenue
Site Amenity Selection
See which amenities, locations, and neighborhoods deliver the best revenue performance
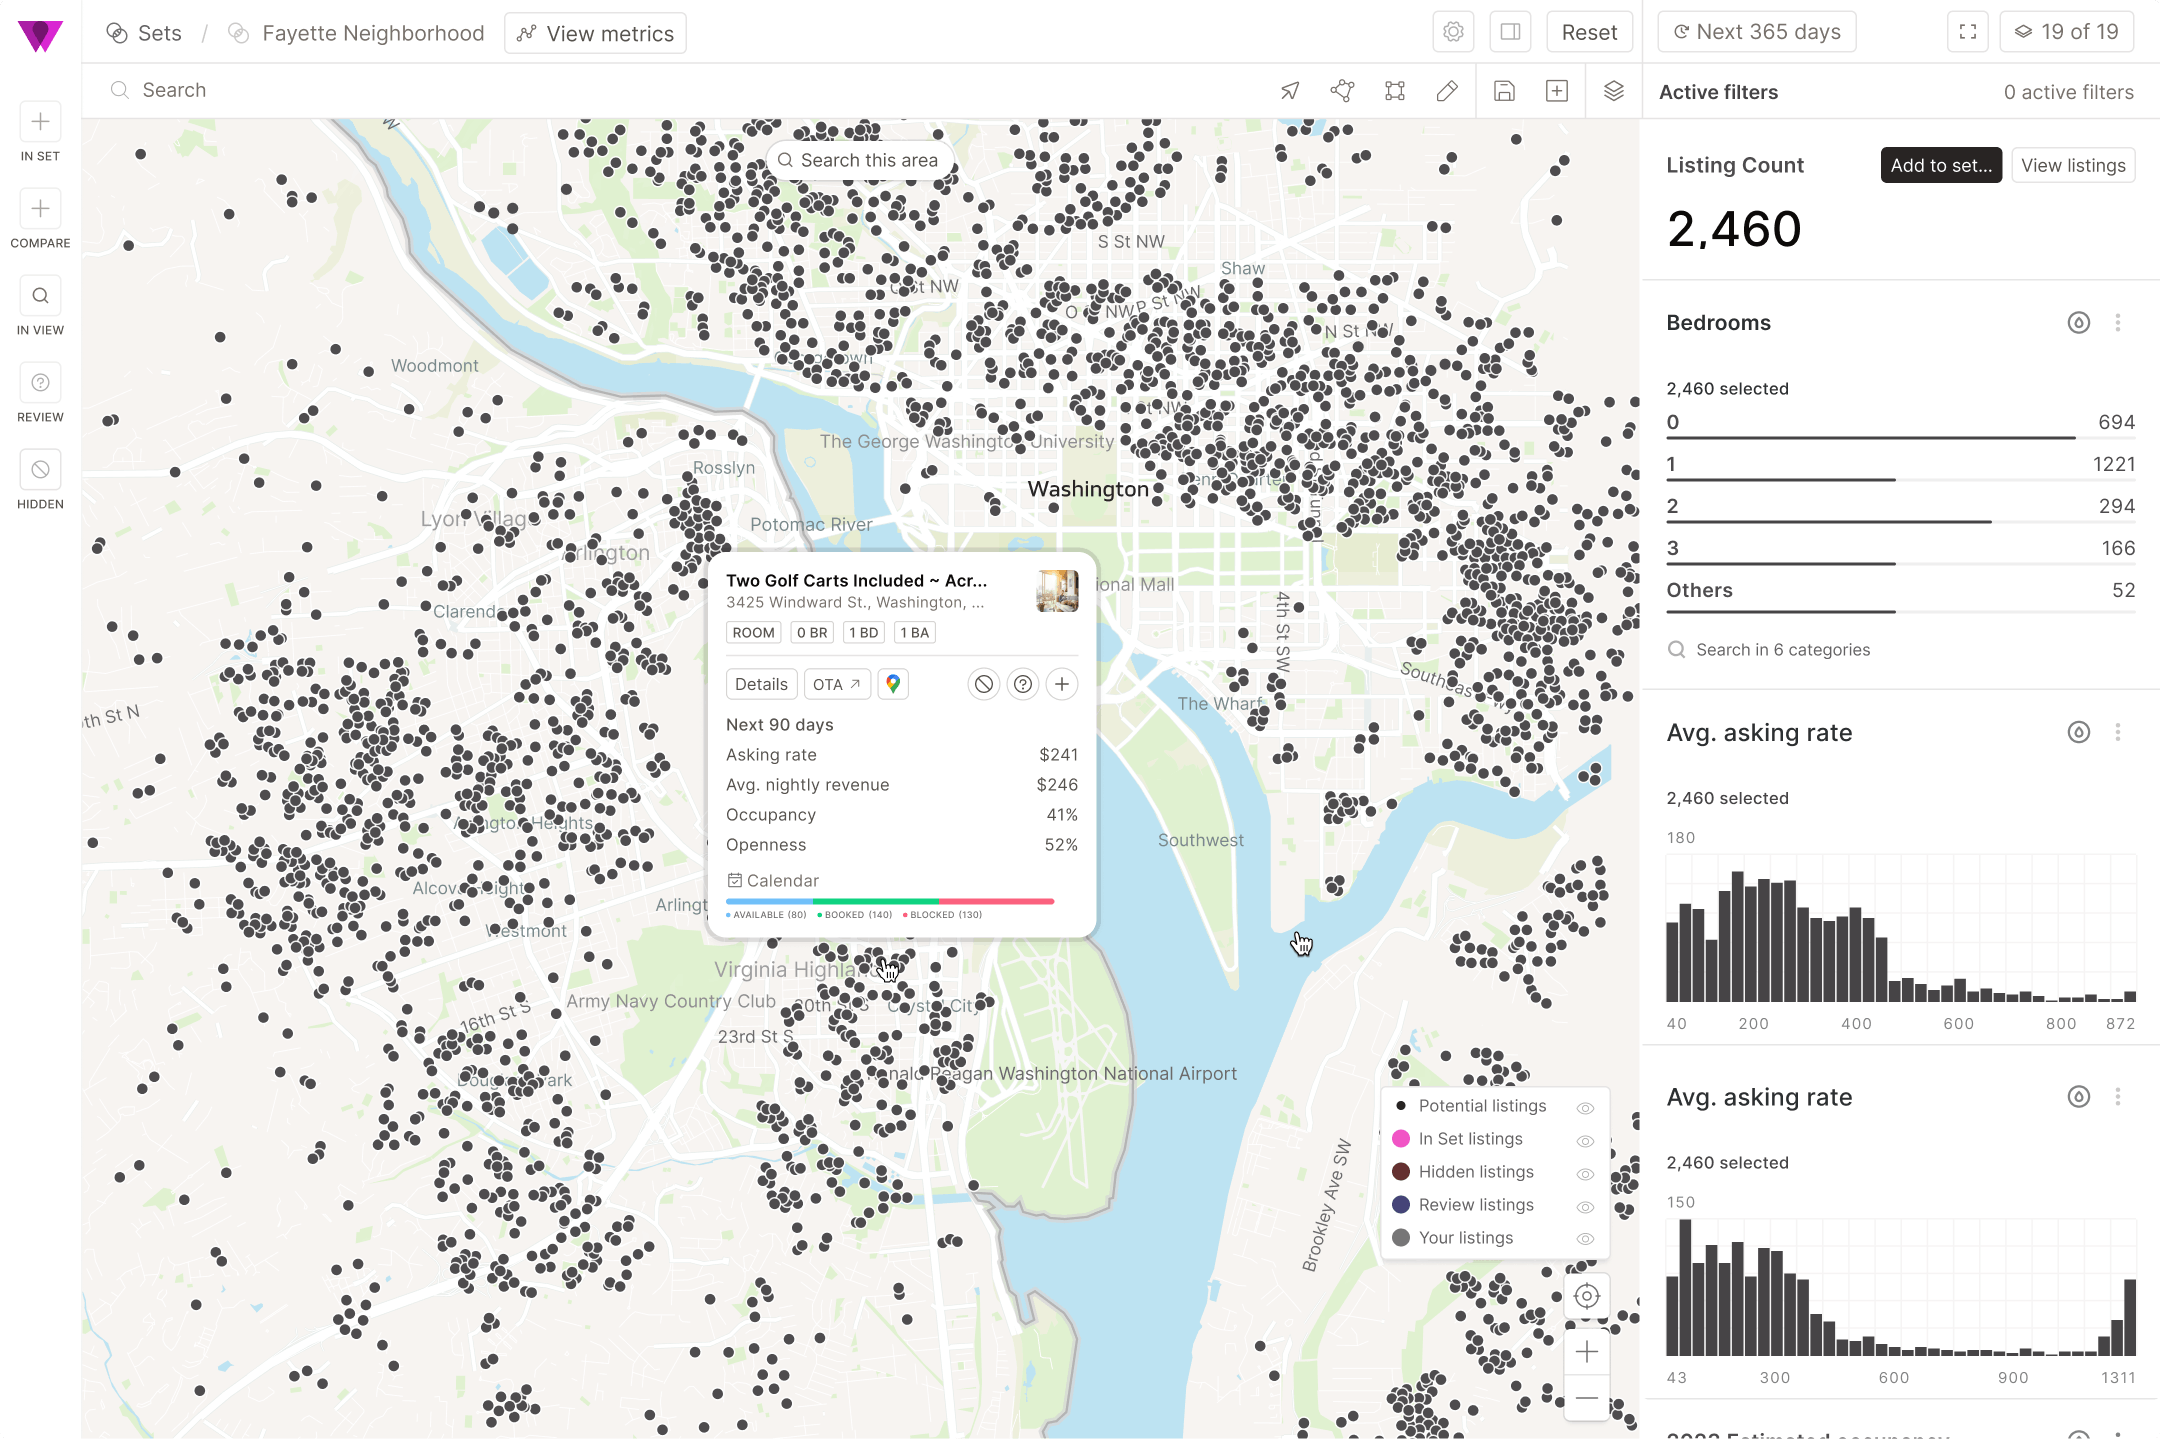
Visualize & analyze without limits
Asking rate

Bedrooms

Avg. nightly revenue

Asking rate
Bedrooms
Avg. nightly revenue
Amenities

Average cleaning fee

Bookable nights

Average rating

Listing count

Average nightly revenue

Average occupancy

Average length of stay

Average ratings count

Configure
Configure the filter sidebar to prioritize the categories and metrics you value most, making it easier and faster to create ideal sets.
Filter
Filter the map's listing markers based on the metrics available in the sidebar, so you can focus on the exact listings you have in mind.
Colorize
Color the map's listing markers based on the metrics available in the sidebar, from number of bedrooms and bathrooms through to Bookable nights.
Your new context
Informative data sets, all at your fingertips
Spatial layering
Every location is so much more than a dot on a map. Leverage or develop your nuanced understand of a market to assess how the larger environment is driving travelers buying patterns.
Performance Metrics
Overlay performance data to see how geography is impacting stay patterns. Leverage revenue to see where travelers have trended toward.
Operators & Inventory
Easily isolate an inventory type (hotel rooms, cabins, 4BR+) to drive your understanding of your relative performance. Or, filter by operators or owners to see how professional supply levels stack up.
Amenities & Attributes
Leverage amenities for YOY investment analysis, or update your seasonal merchandising patterns by seeing how the last pools near you are pricing.
Stay Patterns & Status
Layer in stay patterns to ensure you’re evaluating similar property types. In today flexible travel landscape, similar properties can flex to serve guests for 1 to 100+ night stays.
Combine geographic, performance & stay pattern data to get a true sense of a markets appeal, traveler type and performance.
I'm serious. It's the best system on the market.
Amber Carpenter
Revenue Management & Analytics Leader
|
VTrips
Dynamic Sets
Dynamic Sets - created from Wheelhouse’s Navigator - enable you to continuously track groups of listings - from a single nearby property to 1,000+ multi-market listings - in order to drive optimal financial decisions for your company.
Benchmark
Compare prices
Track performance
Drive strategies
