1 Foundation

Chapter 1 of the Active Revenue Management guide.

Key terms, concepts, and tips for portfolio organization that will help you help you maximize the value of your revenue management practice (and, this guide!)

By Kegan Mulholland, Revenue Manager and Head of Onboarding at Wheelhouse

Updated: Jan 14, 2025

26 minute read

Product image

Intro

Welcome to the Wheelhouse: Active Revenue Management Guide.

This guide is designed to drive a deeper understanding of revenue management (RM), and illustrating how these skills can drive revenue, grow your portfolio, scale your operational efficiency, and ultimately delight your stakeholders (teammates, owners, etc)

This guide is full of skills, tools and techniques designed to help you run your RM operations in a scalable, profitable, professional manner.

This chapter will detail key terms & concepts, the goals of Revenue Management, and more foundational learnings.

Additionally, we'll discuss how to organize your portfolio and how to identify key booking patterns in order to start to fine-tune your RM strategies.

This work will not only help you manage your portfolio better immediately, if you engage with the recommendations, you will be perfect setup to maximize the value of this guide.

Regardless of your experience level, and careful review of the foundation we outline here will ensure you get the most out of this course.

Now, let's dive in!

Free account & BI Tools

With the publishing of this guide, our team has decided to take the BI tools we discuss and make them entirely free.

That means you can both learn more and leverage a free set of tools to drive more revenue, at no cost, immediately.

Once you sign up, you can link any account to analyze your performance, exactly as we teach in this guide.

Get your free Account & BI tools

1.1 What is Revenue Management?

If you have spent time with Revenue Managers you’ve most likely heard the saying:

Revenue Management is the art and science of selling the right product, to the right customer, at the right price, at the right time, through the right channel.

We have always found this adage to be a helpful articulation of the goals and benefits of an effective Revenue Management proces.

Therefore, let's break this saying down in further detail.

The "Right Product"

Regardless of industry, the "right product" is the offering that satisfies the customer's wants or needs.

For example, in the Vacation Rental (VR) industry, the "right product" for a business traveler might be a studio or 1-bed apartment with great Wi-Fi, a working desk, and (of course!) blackout shades.

Similarly, the "right product" for friends traveling to Lake Tahoe may well be a 5-bedroom house, ideally with a pool, hot tub and foosball table.

In our industry, amenity-rich, unique, well-located, well-photographed spaces are "in."

These unique spaces present both a challenge—and an opportunity—for revenue growth via effective revenue management practices.

The "Right Customer"

Finding the "right customer" is all about identifying and targeting customer segments who value the product you sell.

In the above example, you clearly would not want to spend time marketing to - and designing for - large groups if you were managing a studio apartment.

In the VR space, travelers can filter by a broad set of amenities to find their ideal property.

Therefore, finding the "right customer" is all about deeply understanding the types of travelers who seek your inventory, and then better optimizing your online listings, direct site, and marketing efforts to reach & resonate with a similar demographic of travelers.

In the VR industry, the "right customer" is also someone who will treat your property with care!

The "Right Price"

In the VR space, the "right price" is shorthand for figuring out what the market is willing to pay—on a given day—for your unique property.

This "right price" varies over time, as stay dates approach, market conditions change, inventory levels fluctuate, weather patterns emerge, etc.

And, in many ways, the biggest challenge for revenue management in the VR space is, "How can you optimally price a unique asset, when you can only sell each night one time?!"

While perfection is impossible, this guide will help you price more accurately, more often, in a manner that will consistently maximize your revenue.

The "Right Time"

Another adage of Revenue Management is that you "can never sell last night's vacancy."

Therefore, the challenge of any revenue manager is to avoid vacancies (unbooked nights earn $0) while also not selling at too low a price.

This tension is even more acute in the VR space, where property & revenue managers work on behalf of many individual owners.

Each individual owner only recieves revenue if their property books, and explaining to an owner why any holiday weekend was vacant can be... challenging!

Understanding seasonality and booking windows—which we discuss in this chapter and put to use in later chapters—will be key to understanding "the right time" to sell your inventory.

The "Right Channel"

Distribution is a key aspect of an effective Revenue Management strategy.

And, distribution channels (often called OTAs or booking channels) such as Airbnb, Booking, VRBO, and other specialty sites often charge a percentage of revenue for each booking.

In exchange, these sites have the potential to bring you more (and ideally, new) customers.

Additionally, if you advertise in online or traditional media, each advertisements cost money as well.

Generally, you will earn the most money by selling directly to your customers via your website, direct email/outreach, or any other means where your team can process the booking without giving away a large percentage (often 15%+) of your revenue.

But, since monetizing via OTAs/channels is an important component of essentially all distribution strategies, making sure you optimize your listings on these channels (given their unique customer mix) is a critical aspect of driving revenue.

The "Art & Science"

Now, let’s discuss why Revenue Management is described as both an “Art" and a "Science"

The "Science"

Effective revenue management requires data.

From a skills perspective, RM requires the ability to organize, analyze and leverage large dataset that include current market trends, competitive set metrics, your own key performance indicators (KPIs) and more, in order to drive every decision.

Historically, many revenue managers had to develop their own analysis tools — typically in Excel, Google Sheets, Tableau, etc. — in order to visualize and analyze this data. While this still occurs (shoutout to you spreadsheet experts), most teams now leverage one or more specialized softwares in order to create, analyze and edit effective pricing strategies.

In addition to informing pricing strategies, the best RM teams apply data to every aspect of their portfolio strategy - such as Min Stay requirements, Check-In/Check-Out rules, Fees, Photos and more.

Ultimately, this data - well communicated - is the lingua franca of Revenue Management. A necessary component that helps you understand, update and communicate the impact of each element of your strategy.

So yes, "Science" (okay, mostly math!) is a critical aspect of effective revenue management.

The "Art"

It must be acknowledged that all pricing decisions are - ideally - a best possible guess.

This is true whether RMs are creating their own rate plan or leveraging a data-driven pricing engine.

Why?

Because every pricing decision or recommendation is attempting to translate booking patterns (current or historic) into predicting probable outcomes from future uncertainties.

As an example of this uncertainty, during Covid, travel patterns changed dramatically.

Larger homes with pets policies started selling very well, as families chose drive to destinations where they could met up in relative safety. And, for longer trips, people wanted or needed to bring their pets.

Since there was no precedent for these booking patterns, there was no "science" that could have perfectly predicted how to price listings based on these quickly evolving conditions.

And, even if you did think you had handled that rapid change well, how can you verify that you could not have actually derived another 2-5% from some of your nights?

Therefore, the "art" of Revenue Management is about making pricing decisions which are likely imperfect, but is the best possible decision based on what you know today.

And, an aspect of this "art" is the experience a veteran Revenue Manager gains in order to help them pull the right levers, even before a perfect data picture can emerge.

Art, Science and... Communication!

Yet another aspect of the "art" of Revenue Management is how you communicate strategies (which rely on complex datasets, trends, and pattern analysis) to your team, owners, or management in a way that helps increase understanding of past or future strategies.

In fact, communicating your strategy is so important that we might want to say that Revenue Management is the comprised of "Art, Science and Communication."

(Yes, we'll unpack how to communicate revenue management decisions later in this guide)

In total, Revenue Management is a complex and dynamic field that requires a blend of analytical skills, market knowledge, and strategic thinking.

But, by effectively leveraging data and market insights, knowing when and how to make better decisions, and communicating the decisions effectively, you can significantly impact the financial performance of individual properties or entire portfolios, thereby scaling a successful business.

1.2 What is Active Revenue Management?

So, what is "Active" Revenue Management?

The approach we will teach in this guide is not a "set it and forget it" approach (aka automated dynamic pricing) to maximizing revenue.

That might seem strange consider we are a team who has spent 10+ years investing in rigorous data science to drive automated pricing.

However, above any pricing engine, a strategic revenue manager is sure to create results better suited to your unique business needs.

For example... if you got a big booking 9 months out, while Wheelhouse would likely dial up your risk slightly, you might want to dial up your prices a lot.

Therefore, Active Revenue Management will teach you how to combine a data, pricing & insights engine (like Wheelhouse), with your active, opinionated input.

  • Active Revenue Management is aimed at helping you create, analyze, and edit pricing strategies, quickly.
  • Active Revenue Management focuses on developing accelerated techniques to intervene when and where you see fit, with confidence.
  • Active Revenue Management is about communicating better with owners, teammates, and other stakeholders, in order to create more value.

Ultimately, we view Active Revenue Management as both an "ends" (earn more revenue) and a "means to an end" (more revenue, equals owner retention, equals a larger portfolio, equals a more valuable business).

And, we believe that the excellence you achieve in Revenue Management (when viewed holistically) is unquestionably among the most profitable investments you can make this - or any - year.

With that, let's start setting up your portfolio to accelerate your future success.

1.3 Initial Portfolio Setup: Segmentation

The first step of setting up your portfolio for Active Revenue Management is segmentation.

Segmentation is the process of grouping your properties, based on attributes that make them look or book similarly.

Segmentation - when setup correctly - will enable you to quickly identify and analyze patterns (reservations patterns, pricing patterns, listing display, listing restrictions) all in the name of figuring out what is or isn't working, and fine tuning your revenue strategy.

Creating your first Segment

A simple way to figure out which listings belong in a segment is to leverage the definition of revenue management - selling "the right product, to the right customer, at the right time."

Generally, you will want to segment your portfolio based on the tangible ("2 bedroom", "2 bathroom") & intangible ("luxury home", "recent remodel") aspects of your listings.

These include:

  • Listing Attributes (Location, Bedrooms, Bathrooms, Amenities, etc.) - the tangible aspects of your property that are clearly defined.
  • Listing Tags (Luxury/Quality, New Owner, New Listing, At Risk, New Build, etc.) - the intangible aspects of your property, that you and your team define/consider most valuable.

General Examples

  • Market -> Bedroom Count
  • Market -> Neighborhood -> Bedroom Count

Specific Examples

  • Nashville -> 4 Bedrooms
  • Nashville -> Gulch -> 2 Bedrooms

In the examples, we are starting with very basic segmentation, tied to bedroom counts.

Listing size greatly impacts booking patterns, including the amount guests are willing to pay, how these listings book for events/high season/weekends, how early these properties book, etc.

Therefore, creating Segments based on bedroom count is almost always a helpful foundation.

Determining additional Segments

To continue building helpful segments, begin by building a list of some booking or inquiry patterns you've noticed on your portfolio.

  • Do you have different markets, buildings, bedroom count and types of properties? (The basics!)
  • Do your places with pools sell much better?
  • Do travelers often inquire about a specific neighborhood?
  • Are some of your properties much more luxurious?
  • Do some properties always sell out early for events or specific seasons?
  • Do some properties welcome longer or shorter stays?

These questions and observations are examples of performance drivers that - when organized well - will help you make better, faster decisions on the right strategic adjustments to make for your properties.

1.4 Advanced Segmentation

Multi-Segment Setups

In the VR space, your listings can - and often should - belong in multiple "segments".

This is because booking patterns can emerge around property locations (e.g. near a venue), property attributes (e.g. ski-in, ski-out), booking types (e.g. mid-length bookings), listing restrictions (e.g. 6+ day min stays) and more.

And, since recognizing booking patterns in any of these segments can drive better outcomes for your listings, you should quickly move toward leveraging a system that helps you manage your portfolio in a precise, multi-dimensional manner.

Hierarchical Segments

More advanced revenue teams develop hierarchical segments, that allow them to easily zoom in or zoom out on their overall performance.

For example, you might want to have many of your listings in a "market segment" (e.g. "Lake Tahoe"), and then also have sub-segments built out for each town, neighborhood, or location (e.g. beach front or ski in/ski out) that might be a driver of demand.

This organizational approach is designed to enable you to quickly compare any segment and sub-segment, in order to derive trends that might be working across markets.

For example, if you can easily spot trends in how large homes are performing in one ski market, you may well adjust prices in other ski markets accordingly, depending on how those sub-segments compare.

Specific Examples

  • Vail -> 1 Bedrooms -> Ski-In/Ski-Out
  • Destin -> 2 Bedrooms-> Snowbird Stays Accepted
  • Phoenix -> 5 Bedrooms -> Pool

Performance-Driven Segments

Another valuable view of your portfolio is to Segment listings based on performance.

For example, let's say you had your summer high season starting in 30 days (we'll show you how to determine this soon!) and you wanted to make sure that all properties had at least 30% occupancy going in to high season.

One segment you'd want to create and view every day is "What listings have NOT reach 30% occupancy for the next 90 or 180 days"

Properties that consistently missed your performance marks could be candidates for a tag (e.g. high seasonal laggard) to help you better manage those listings in following years.

While revenue & occupancy are valuable performance metrics to group & manage inventory around, you can also consider metrics such as:

  • Review Count
  • Review Score
  • Recent Bookings
  • Revenue, compared to Last Year
  • Revenue, compared to Competitors

Segments on Wheelhouse

Segmentation is an essential part of effective revenue management.

Therefore, Wheelhouse has focused on developing Segmentation tooling that that enables revenue managers flexibility and scalability of their segments, including advanced features such as:

  • Metrics-driven segments
  • Hierarchical segments
  • Tag-driven segments
  • Tag chaining segments (e.g. has 1 tag, does not have another tag)

These views can be "static" (always the same view) or "dynamic" (tied to a changing variable such as occupancy levels) that is always up to date.

Additionally, you have the ability to save any segment you create, and share that view/grouping with your teammates.

And, you can carry this segment into every aspect of our platform - including your pricing & setting views, performance analysis, owner reports, and more.

Learn More

Examples of Attribute Driven Segments / Sub-Segments:

  • Market (Nashville)
  • Market + Neighborhood (Nashville + The Gulch Neighborhood)
  • Market + Neighborhood + Bedroom Count (Nashville + The Gulch Neighborhood + 2BR)

Examples of Tag Driven Segments:

  • Nashville + Luxury
  • Nashville + 2BD + Luxury + New Owner

Example of Performance Driven Segments:

  • Nashville + Luxury + Bookings in L30 Days
  • Nashville + Luxury + Occupancy <30%

On Wheelhouse or any RMS, you will want to take time to organize "Tags" to help create these "opinionated" segments.

And, your RMS should automatically help you create segments based on the current performance of your listings, so you can always quickly cut to under/over performing listings to figure out how you should adjust your strategy.

Segmentation is an essential part of building a good foundation for Revenue Management, as it will provide you with a foundation or creating, analyzing, editing & reporting your booking performance in order to drive more revenue and communicate your strategy/successes.

Therefore, you will want to ensure you can setup your portfolio in a way that allows you to easily "slice and dice" your portfolio dynamically, in order to maximize your ability to leverage learnings that drive your revenue & performance.

1.5 "Seasonal" Demand Patterns

When organizing and managing a portfolio, Revenue Managers often use "seasonal" patterns to create more advanced & precise strategies.

And, by taking time to consider, document and plan for your market's seasonality, you can drive better performance (and scale) around many activities, including:

  • Setting rates according to historic/predicted demand
  • Calculating booking windows according to historic demand
  • Forecasting revenue according to historic/predicted demand

Revenue Managers leverage the seasonality structure they create to inform decision making, reporting, and forecasting for their team.

It is relatively easy to use data to measure seasonality patterns. However, it is useful to remember that what most of us think of as "seasons" generally shift slightly year-to-year.

And, depending on what you consider a "season", it's not unusual for something like spring break or a holiday to shift slightly, greatly impacting what the industry (and travelers) may think of as the start or the end of a season.

Definition

Seasonality refers to relatively predictable fluctuations in demand that occur over the course of a year. In the context of the hospitality and short-term rental industry (STR), it's typically divided into three main categories:

  • Low Season: Periods of relatively low demand.
  • Shoulder Season: Transitional periods between high and low seasons. Shoulder seasons are either a transition from a high season to a low season or a low season to a high season.
  • High Season: Periods of peak demand.

Defining seasonality is not a 'hard science', nor is it completely standardized (yes, you could call this "Art"!)

However, almost everyone in our industry will understand the concept of high, low and shoulder seasons, and develop strategic approaches that cater to these seasons' specific booking patterns:

  • Basic approach: Define High & Low seasons
  • Getting Better: Defining High, Low, and Shoulder seasons
  • Advanced approach: Defining additional Seasons (e.g. Spring Break) for even greater precision

A solid understanding of seasonality will help you create and analyze the right pricing & portfolio strategies to earn the most revenue during periods of high & lower demand.

Additionally, having a solid understanding of booking patterns for a season will help you identify other demand drivers - such as events - more quickly and precisely.

Keep in mind that seasonal patterns can shift over time. Therefore, it is important to analyze and consider whether these changes represent temporary fluctuations or genuine shifts in seasonal patterns, in order to fine-tune your strategy.

Temporary Change to Seasonality: 

  • Post Covid-19 boom in traditionally “shoulder” seasons in many markets
  • Hurricane Season Arriving early or Late

Permanent Change to Seasonality:

  • Changes in “back to school” schedules
  • A mountain market which keeps receiving less and less snow limiting the ski season

Example of what Wheelhouse might identify in turns of Seasonal Demand

blog image

Green: High, Orange: Shoulder, Red: Low, Blue: Example of Date with high demand within a Low Period which is most likely due to Easter

Characteristics of Seasonality

  • Cyclical Nature: Seasonal patterns tend to repeat annually, though the exact timing may vary slightly from year to year.
  • Market (or submarket)-Specific: Seasonality can vary significantly between different markets however most properties within the same Market or Submarket will follow a similar trend. For example, a beach destination might have a different high season than a ski resort.
  • Impact on Key Metrics: Seasonality directly influences important revenue management activities such as setting price and forecasting performance and will be visible in metrics such as Average Daily Rate (ADR), occupancy rates, and RevPAR (Revenue Per Available Room).

1.6 "Day of Week" Demand Patterns

Revenue managers use Day of Week (DoW) booking patterns to optimize pricing strategies, as traveler demand levels and "willingness to pay" can vary significantly, depending on the day of week for a given stay date:

Why DoW pricing strategies are valuable to consider:

  1. Earn more from different Stay Patterns: Urban properties often see midweek business travel and weekend leisure travel. Resort destinations may see extended weekend patterns (Thursday-Sunday). And, in the VR space, properties can often drive longer stays focused around weekends with smart pricing, min stay, or strategies.
  2. Earn more from "Willingness to Pay": Not only is there more demand for most weekends, but most travelers also have a higher "willingness to pay" for places that might serve as the foundation of their perfect vacation.
  3. Drive operational efficiency: By encouraging longer stays or checkouts on particular days, teams can minimize vacancies, optimize turnover/cleaning costs, and more effectively manage their inventory and levels.

In the VR space, properties can see highly variable Day of Week pricing strategies.

Developing your ideal DoW Strategy

  • Analyze historical booking data to identify consistent patterns that might drive effective strategies. Signals you will look for include, "Which days consistently have higher/lower occupancy?", "What are average rates achieved for each day of week?", "What length of stay patterns do you see for each day?" This information can serve as the foundation of optimizing many aspects of your pricing strategy.
  • Differ pricing strategies tied to DoW. In most markets, this means setting higher rates for peak demand days (often Friday/Saturday) and lower rates for softer demand days (often Sunday-Thursday). However, this can also include setting special pricing for days that transition between business and leisure travel, and particularly "gap nights" that might emerge during high or low weekly demand times.
  • Create day-specific minimum stay restrictions: And, just like pricing is important, your stay restrictions should almost certainly vary by day. Most importantly, you want to prevent single-night bookings on high-demand days, and may even want to require bookings to include low-demand days with high-demand days (e.g. setting a "week long min stay").

Developing Segments around DoW Patterns:

In fact, booking patterns can vary so much you may well want to think of tags (or, metric filters) that help you easily identify your strong weekend/weekday performers, to develop specific pricing, min stay, or fees structures around these listings.

Consider adding tags such as "Weekend Focused", or "Week-Long Summer Rentals" to your tagging system, depending on how your portfolio books.

1.7 "Event" Demand Patterns

Pricing events well is the most important - and the most difficult - aspect of revenue management.

Events - which can include conferences, festivals, concerts, professional sports, weddings, political gatherings, marathons, and more - are difficult to predict as so many variables can play in to their demand patterns.

  • In a small market, a large wedding can significantly alter available supply.
  • A conference for a rapidly growing technology field or sub-culture can see demand patterns change a lot, year-over-year (e.g. the stunning rise of ComicCon)
  • A festival might draw people from afar, or it might draw family members from nearby more willing to stay at their relatives home (and thereby not drive up demand)
  • Major holidays can shift around year-over-year, sometimes landing on weekends, and sometimes slipping back/forward a month.
  • Overlapping events may steal travelers from each other - either within a market or in nearby markets.
  • A big snowstorm might be the boom or bust for a weekend or an entire spring break.

In short, so many variables can drive booking patterns for events that it is incredibly hard to execute a perfect strategy for an event.

Amplifying the problem?

Pricing mistakes around events can have significant consequences, from selling too early (and missing out on revenue) to not selling out a major holiday. And either of these mistakes can be the reason an owner decides to churn from a property manager, meaning events are high reward, but very high risk, revenue drivers for portfolios.

Therefore, let's discuss some strategies that can better position you to predict - and react to - booking patterns around events.

How to Develop Event-Based Pricing Strategies

  1. Identify and classify relevant events: First, you and your team should spend time annually identifying major events (festivals, conventions, sports championships), annual recurring events (graduation weekends, local festivals), one-time events (concerts, tournaments, conferences) and holidays that might impact each of your properties.
  2. Analyze historical event impact data: As often as possible, you will want to compare booking patterns for repeating events - looking for details about occupancy rates, ADR, pacing, and more event demand elasticity around inventory types (for example, for Coachella, places with pools sure sell well!). This data might come from your portfolio, or analyzing CompSet or market-level data.
  3. Communicate! Next, you will want to share your list of events - and any data/patterns you see - with owners or teammates, to confirm how you should best handle these very sensitive time periods.
  4. Implement tiered pricing strategies: Most likely, you will want to create event-specific strategies - such as rate increases, minimum stay requirements, different cancellation policies, deposits (especially for rowdy events), fees, and more.
  5. Monitor competitive positioning: Lastly, you will want to have these events well documented, so you can easily monitor how these events are performing, in order to adjust pricing based on remaining market inventory and booking patterns you are seeing.

Seasonality & Event Setup on Wheelhouse

Wheelhouse recently launched an Event & Season Manager, to help you more precisely manage.

When you create these events or seasons, you can now very easily setup rules (Min Prices, Last minute discounting, etc.) that apply specifically to these time ranges.

Additionally, you can leverage events & seasons in your Data Dials, enabling you to use as much (or little!) market data or historic booking data for each of these time ranges.

1.8 Demand Patterns: Booking Windows

The term "Booking Window" refers to the time range in which the highest number of consumers are looking for - and booking - properties.

For example, before summer high season months, you can expect many guests (particularly families) to look for a home to book many months prior to the stay date.

Often, this "peak booking window" is 3 to even 9 months prior to those stay dates.

Leveraging data about your booking window will help you drive your ideal strategy for each property.

Generally, if you are focused on occupancy, you will want to ensure you go "into the Booking Window" with some bookings already locked in for your homes.

Or, if you want to focus on drive high rates to your homes, you may well want to wait for the booking window to hit full swing before fill your calendar.

Often times you will hear people use the term Booking Window and Lead Time interchangeably.

While these terms may be similar and in some regards mean the same thing, we like to think of Booking Window as a more general term for the aggregated Lead Times for individual reservations within a market or your own portfolio.

Definition

Booking Window describes the distribution of how far in advance reservations are made for a given time period, typically viewed by segments of your portfolio or the market (e.g., all 5 bedroom homes in your portfolio).

Your Booking Windows determine the time periods in which your rates should be "well optimized". They also tell you when to make changes to your rates and strategies based on how your portfolio is performing at that time (e.g., you may opt to decrease your min. length of stay requirement just after you've exited your major booking window for an event or season).

Booking Windows can be determined a number of ways:

Intuition

“I want to be 80% booked by 30 Days Away”

Market Data

“The median booking window is X for the 2 bedrooms in my market for the month of April”

"The average booking window for the summer months in my market is about 60 days"

Your Direct Data

"Last year we sold 70% of our inventory for the summer high season by March 15th"

Think of Booking Windows in your strategy as thresholds where your strategy changes or where you would take action.

Booking Window Video

In this video John deRoulet from Wheelhouse offers a "live" analysis of Charleston's high season Booking Window.

Below is an image from the Wheelhouse Markets page for Seattle, WA which shows the distribution chart for Lead Times for August 2024.

In this case, the data illustrates that the median lead time for August is right around 50 days, based on this chart. I could use this as my guideline for planning a strategy around this historic booking window.

However, it is worth noting that you don't simply want to wait until your booking window starts to being fine-tuning your pricing strategy.

Monitoring your "booking pace" (more on this later) and making the call to adjust pricing earlier than 50 days will need to happen.

blog image

Practically speaking, booking windows are rarely exact measurements.

New events, market conditions, competition, trends and more are always shifting, and can cause the booking window for a series of days or a season to shift dramatically.

For example, if you have determined that May's booking window is usually 60 days, if you fail to pay attention to booking patterns outside of the booking window, you might miss notice that a concert or event has started to shift booking patterns well before the "booking window".

Therefore, your team should leverage booking windows as a general - but not precise - input into your decision making process (more on this in the "Chapter 2: Intervene") in order to drive better performance from your portfolio.

1.9 Establishing Benchmarks

In the accommodations industry, benchmarking refers to the process of comparing your property's performance against the performance of competitor, market or industry standards.

Benchmarking helps managers, teammates and other stakeholder make informed decisions about pricing, revenue strategies, operational improvements, investments, and more.

Types of Benchmarks

The most common "types" of benchmarks are:

  • Tied to Market Performance
  • Tied to CompSet Performance
  • Tied to Historic Performance
  • Tied to Segment Performance

In this section, we will discuss Market & CompSet benchmarks, and how you can setup and leverage them.

The challenges of establishing Market & CompSet Benchmarks

In the hotel space, benchmarking is a well established practice that drives both operational and investment decisions.

For some measure though, hotels have it relatively easy when it comes to benchmarking. For example, hotels have relatively straightforward "categorization", meaning a 3 Star Hotel will usually benchmark against other 3 Star Hotels.

And, hotels can bank on the fact that their competitors have relatively fixed supply levels. Therefore, they have a very "controlled" setting that produces benchmarks that are very easy to leverage.

Of course, the vacation & short-term rental space has no such luck. Perhaps the signature of our industry is that:

  • Every listing is unique
  • There is no clear categorization of supply quality
  • Supply levels can vary dramatically day-over-day, weekend-over-weekend, or season-over-season.
  • Management models differ (owner-occupied, owner-managed, professionally managed, etc)
  • Amenity profiles vary widely (e.g. you might compete against places with a pool in the summer, and a hot tub in the winter)

Therefore, finding the right group of listings to leverage for benchmarking can be a much more nuanced and challenging activity.

Despite that, creating even imperfect benchmarks can be an exceptionally powerful aspect of your revenue strategy.

Market Benchmarks

Leveraging a Market Benchmark is a great way to broaden your horizon, and to see generally how your market is performing for any given time period.

A helpful market benchmark will help you see how any property - or your whole portfolio - compares across metrics like ADR, RevPAR (these metrics are defined below), occupancy, lead times, pricing patterns, seasonal performance, and more.

By making sure you have access to a broad view of your market's performance, you can ensure you understand macro trends, in order to better set expectations for variability in seasonal or year-over-year performance.

blog image

In the example above, we leverage a Market Report for Breckenridge to analyze the "Adjusted Occupancy" rate for the market, over the the last 2 years.

This data could tell you many interesting things including:

  • What should I expect (or budget for) this year's occupancy?
  • What might have changed in my market lately?
  • How did my best and worst properties compare to these occupancy rates?
  • Do my listings under/over perform the market during any times of the year?
  • How should I think about my operational needs throughout the year?

While Market Benchmarks provide a broad view of your market, they are an essential and easy to leverage tool to fine-tune a general revenue management strategy.

Free Benchmarking tools from Wheelhouse

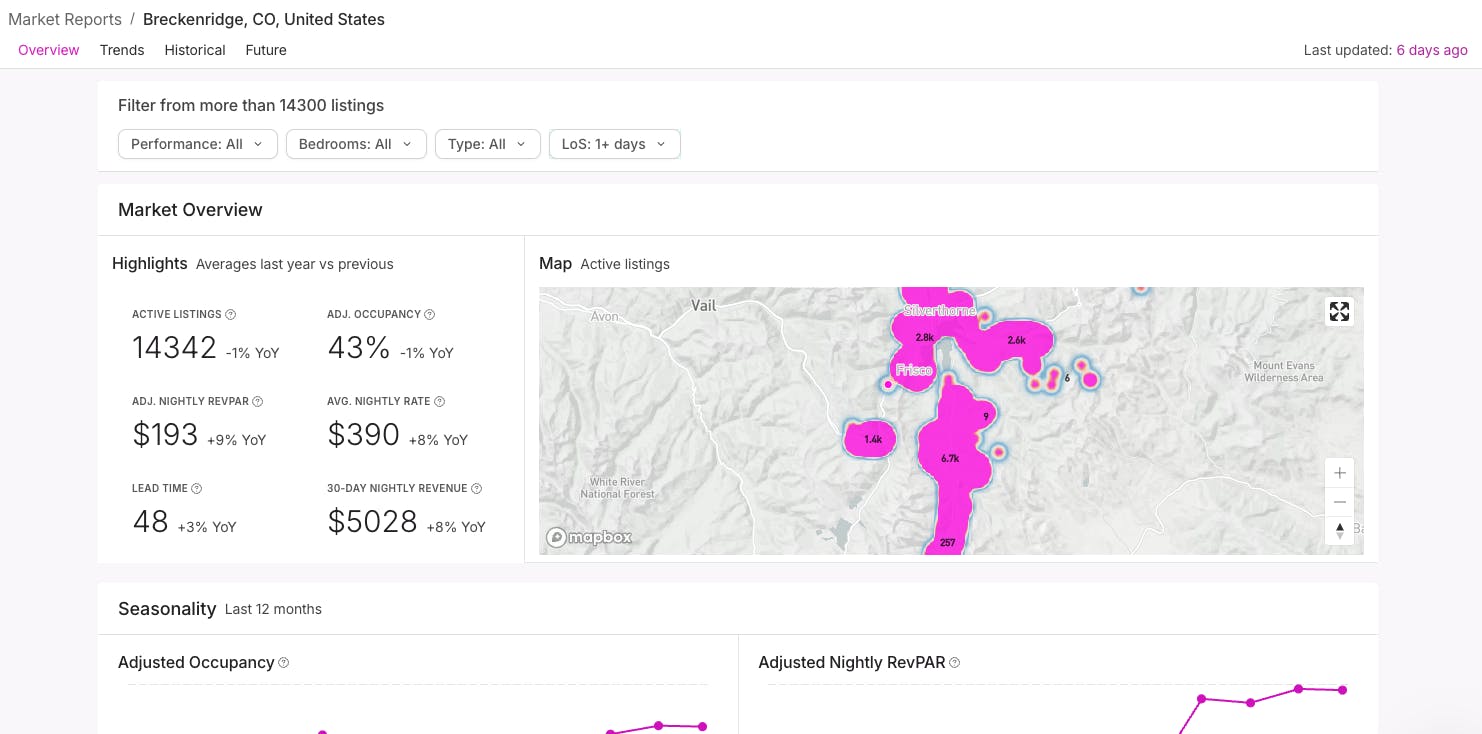
Wheelhouse provides free Market Reports that can inform benchmarking for your portfolio.

When you connect an account to Wheelhouse, we will automatically detect which markets you are in, and add those market reports to your account.

Market Reports are updated weekly, and enable you to review historical, current and upcoming booking patterns.

CompSet Benchmarks

To refine your benchmarking, you will want to focus the listings you leverage for benchmarking.

And, especially given the uniqueness of listings in the VR space, your revenue management practice will evolve significantly when you can quickly isolate the correct listings to listen to, in order to benchmark your performance precisely.

This set of properties is referred to by the industry as your "CompSet", or a small group of similar properties that you can count on to be reliable indicators of performance.

Ideally, this will be 10+ properties which are similar in location, size, amenities, and quality level. (And, large sets can certainly include 100+ properties)

With this set, we'll want to focus in on these listing's performance metrics - including pricing strategies and responses to high-demand periods. This focused analysis will help you identify performance gaps and opportunities directly relevant to your property.

And, with shifting travel patterns (e.g. especially on Airbnb travelers will now seek out properties with specific attributes, even before finalizing a destination!) you now need to be cognizant that your ideal competitive set might not even be in your market!

Developing the right CompSet

There are many correct ways to construct a CompSet. However, generally there are a few parameters you can leverage to more quickly construct a helpful CompSet. These parameters include:

  • Listing Size (e.g. 4 BR or 7 sleeps)
  • Listing Proximity (e.g. Same market)
  • Similar amenities (e.g. pools, porch, patio, hot tub, beach front, electric chargers, etc.)
  • Similar operators (e.g. managed by professionals, or managed by owners)
  • Similar quality (e.g. luxury, etc)
  • Similar availability patterns (e.g. available all year, just for high season, just for events, etc)
  • Similar stay patterns (e.g. guests generally stay for similar lengths of time, etc)

As noted above, it's quite common for Property Managers to "Comp" against listings just because they are managed by another PM.

In the VR space, there is rarely one perfect CompSet.

And, to make matters more complicated, your CompSet may change seasonally (e.g. you compete with some listings in the summer, and others in the winter)

Given this complexity, we'd consider defining a "good" CompSet is a group of listings that illustrates at least a few things you can do to earn more revenue.

If you start with that as the goal, your sure to drive success from the practice of selecting, measuring against, and learning from a CompSet.

The next generation of CompSets: Dynamic Sets

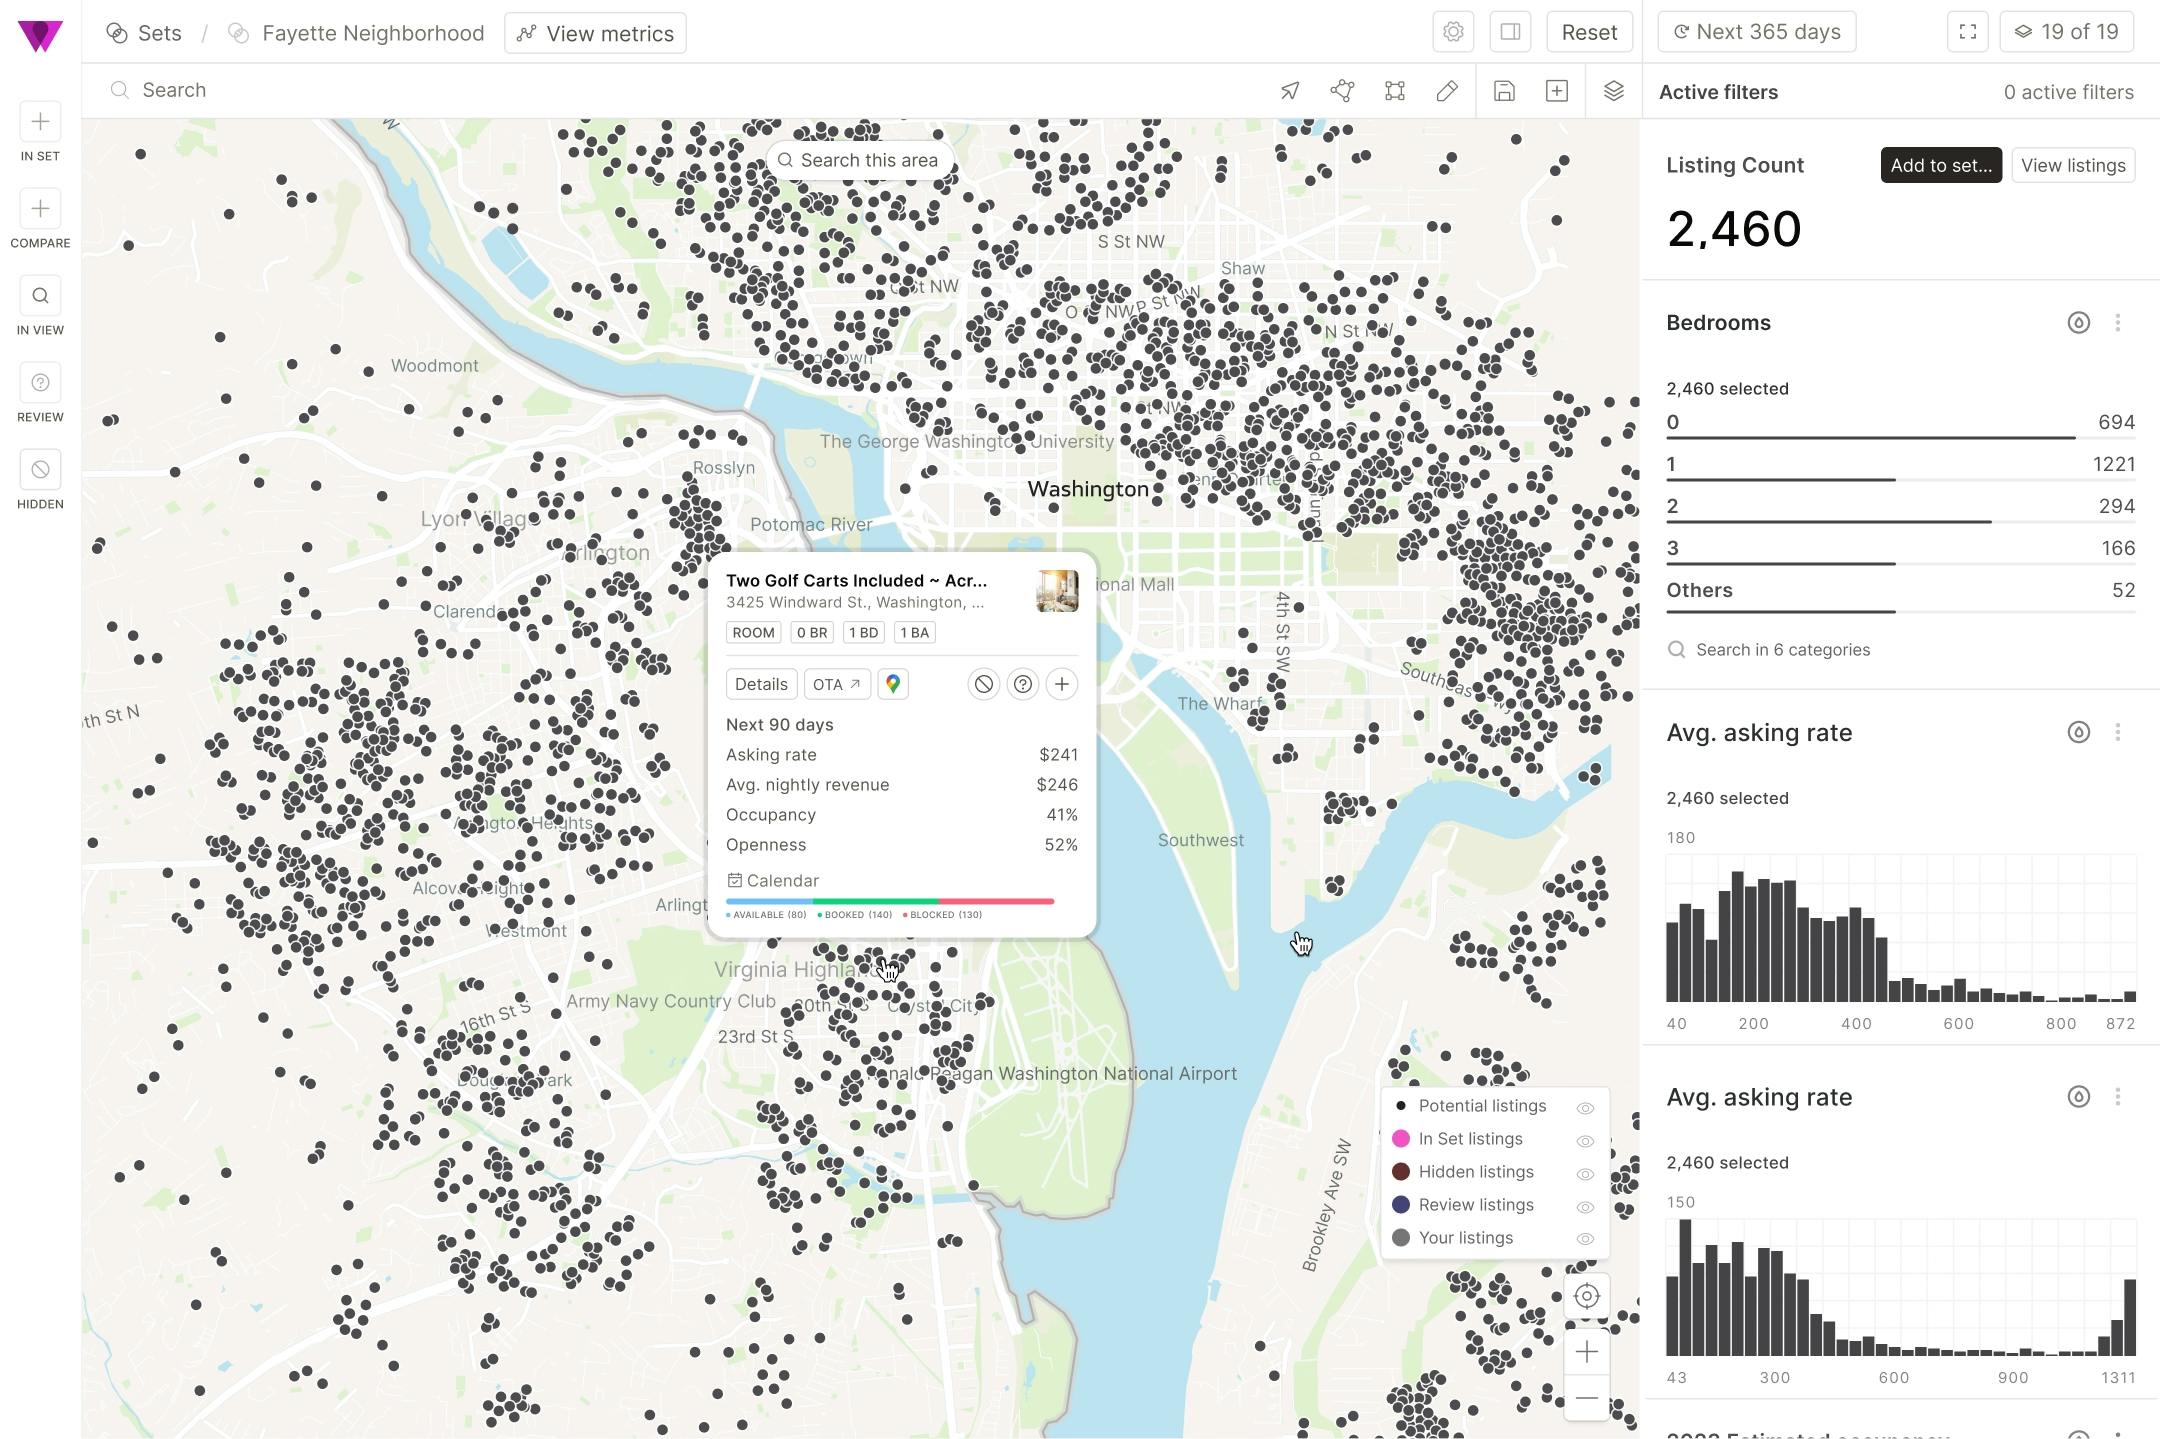
For a more precise view of your competitors, Wheelhouse has an offering called Dynamic Sets.

Dynamic Sets lets you precisely define boundaries, filter by almost any attribute of a listing (performance, amenities, operator, inventory type, etc) in order to create a precise comparison for each unique listing.

Additionally, Dynamic Sets allows you to look across multiple markets, and then bring any insights and learnings deeply into your Revenue Management strategy.

1.10 Metrics and Calculations

Learning the language of revenue management will greatly accelerate your ability to communicate with and learn from others in our industry.

Therefore, let's take some time to discuss the definition of - and how to calculate - some of the most essential metrics.

Note that the nomenclature in our industry is not always consistent, even within software platforms!

For a more robust exploration please visit Wheelhouse's Lexicon page

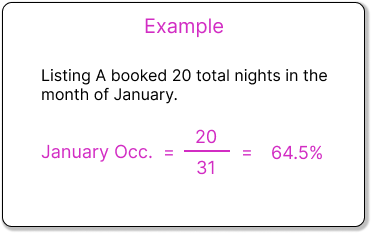
Occupancy (Occ.)

Percentage of nights booked out of total nights in a time-frame.

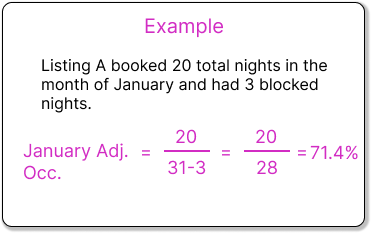
Adjusted occupancy (Adj. Occ.)

Percentage of nights booked out of bookable nights, i.e. excluding blocked nights, in a time-frame: booked nights / bookable nights.

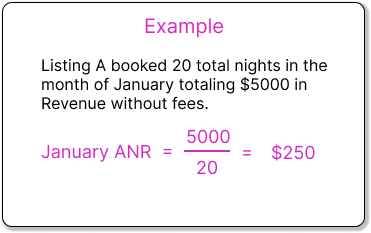
Average nightly rate (ANR)

Average nightly price of booked nights in a time-frame.

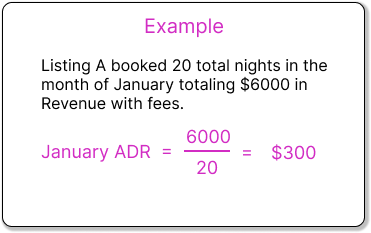
Average daily rate (ADR)

Total revenue in a time-frame divided by number of booked nights in the time-frame. The biggest distinction between ANR and ADR is the inclusion of fees: ANR does not include fees and ADR does.

Note: Average Daily Rate (ADR) and Average Nightly Rate (ANR) are often used interchangeably. At Wheelhouse we refer to ANR as the average booked rate without fees included and Average Daily Rate (ADR) as the average booked rate with fees included. Refer to our Lexicon (linked above) for more info.

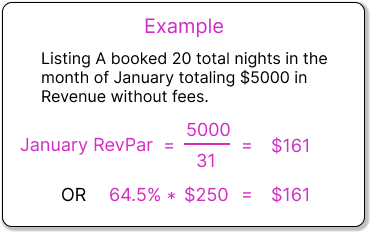
Revenue per Available Room (RevPar)

Total revenue in a time-frame divided by number of calendar nights in the time-frame. Equals ADR * Occupancy. Similarly to Occ. and Adj. Occ, you can also calculate Adj. RevPar.

Asking Rates

In Wheelhouse's Lexicon we define Asking Rates as:

"Average nightly price of bookable nights, i.e. excluding blocked nights, in a time frame."

Which is right, sometimes.

Asking Rates are simply the rates that you are advertising for each day within a time period. It is important to understand not just the Average Asking Rate, but the day-by-day variation in your asking rates throughout a week, month, or season.

1.11 Pricing & Distribution Softwares

As discussed earlier, when In developing the right strategy for your portfolio, most teams now use specialized Revenue Management softwares to create, analyze, edit & communicate strategies.

Once you have your revenue strategy perfect, it's time to distribute these rates to all of your distribution channels (your direct site, OTAs such as Airbnb, etc)

In many cases, there are at least 2 systems involved in managing rates, distributing rates and capturing reservations. These include:

Revenue Management System (RMS) or Dynamic Pricing (DP)

RMSs are where team create and manage pricing strategies, using rule-based or data-driven strategies. Common RMSs in the VR space include Wheelhouse (oh hey!), Beyond Pricing, Pricelabs, RevMax, Rented, and other softwares.

Property Management System (PMS)

As portfolios scale, operators will often look to leverage a PMS. PMSs help operators manage many aspects of their listings, including property attributes, guest comms, fee info, etc. are stored. Often times a PMS will also include Channel Management or listing distribution.

There are dozens of PMS platforms in the VR space that specialize in various domains (distribution, accounting, guest comms, etc).

Wheelhouse integrates with many of them, including all of these PMS partners.

Channel Manager (CM)

Most PMS platforms now include Channel Management products in their offering. However, for specialty channel management, teams will partner with Rentals United, BookingPal, and other specialty players.

Channels

Channels can include Online Travel Agencies (OTAs) like Airbnb, VRBO, or Booking.com, or your own direct booking website.

In order to discuss how rates and other information flows around this ecosystem, let's explore a scenario where you are using all four components (RMS, PMS, CM and channels) as many of the recommendations we discuss will still be applicable if you are using fewer systems. 

blog image

1.12 Distribution "How it Works"

Whenever working with 2+ softwares, you need to ensure these systems communicate effectively.

Therefore, if you are leading RM, some of your time must be dedicated to ensuring the correct prices, restrictions, and fees make it to each channel where you sell (remember... right price, right channel, etc!)

Therefore, you will want to have a detailed understanding of how your technology stitches together, in order to quickly figure out how to solve any potential problems that emerge.

Whenever software systems communicate, these systems (by design) will agree on which system is the "Source of Truth" for storing and updating data.

Therefore, let's examine how the "Source of Truth" is usually setup in the VR space, but please keep in mind that this may vary based on the softwares you use!

"Source of Truth" is your RMS

  • Rates
  • Minimum Length of Stay
  • (Sometimes) CTA/CTD Restrictions

"Source of Truth" is your PMS

  • Availability
  • Fees
  • Taxes
  • (Sometimes) CTA/CTD Restrictions

"Source of Truth" is the Channel

  • Reservations

If something looks amiss, you will often need to look at pricing & strategies in each of these systems, as they might be the breakpoint that caused an error - leading to incorrect pricing (or worse, bookings) to occur.

1.13 Troubleshooting Incorrect Rates

If leveraging an RMS or PMS to set rates/prices, rates will always flow from your "source of truth" to the to Channels, in the follow sequence:

  1. RMS (Rate Management System) - source of truth
  2. PMS (Property Management System) - potential source of truth
  3. Channel Manager
  4. Channels (OTAs like Airbnb, Booking.com, etc.)

When trying to track down a "rate" issue (i.e. you see an incorrect price on a channel) you will always want to try problem solving by starting with your "source of truth".

Being process driven in stepping through this evaluation path will greatly accelerate your trouble-shooting.

Step 1: Check the RMS/PMS

Depending on where you are setting/automating rates, start by verifying that your RMS/PMS is showing the correct rate for each date/time period.

Step 2: Follow the Chain

If the RMS looks correct:

  • Compare the RMS rates with PMS rates, reviewing the individual or a grouped calendar view.
  • If those rates do not match, you need to communicate to each vendor about the issue.
  • If those rates do match, next compare your PMS rates with the Channel or Channel Manager rates, and repeat.

Step 3: Identify the Breakpoint

By following this process, you can pinpoint exactly where the rate discrepancy is occurring, and therefore which vendors to contact to resolve this issue.

1.14 Troubleshooting Incorrect Reservations

If the rates look correct everywhere but a reservation is still wrong, it's time to run a different analysis to determine:

  1. Is reservation data is being "split out" incorrectly as it flows through systems (e.g. taxes, fees, discounts, or other is not being correctly communicated between systems)?
  2. Is some other aspect of an integration broken?
  3. Or, could multiple issues be occuring

Step 1: Consider the Reservation as Truth

Reservations always flow from the channel to the PMS/RMS:

  • Check the channel-side revenue breakout (rental revenue, fees, etc.)
  • Compare with Channel Manager or PMS reservation details
  • If those breakouts don't match, you've identified the teams that need to fix their connection.
  • If those breakouts do match, compare this to the RMS reservation details

Step 2: Pay Special Attention to Fees

While rates originate from one source, fees can be configured differently in each system. Additionally, these are often displayed differently across channels and systems.

Therefore, you will often find that extra fees are a source of technical issues between systems.

Step 3: Check Totals

Always verify both:

  • Rental Total
  • Gross Total (all fees included)

Problem-Solving Summary

  1. Identify the incorrect component (rates, fees, taxes)
  2. Trace the reservation backward through your software systems
  3. Compare both Gross Total and Room Rental Total
  4. Contact relevant vendors when you find the breakpoint

When Contacting Vendors, Include:

  • Screenshots of the component in each system
  • Reservation ID and dates
  • Clear description of the discrepancy

Course Page

Next to 2 - Identify

3 - Intervene

Contributors

author image

Kegan Mulholland

Revenue Manager and Head of Onboarding at Wheelhouse

Kegan is a seasoned Revenue Manager and heads the Wheelhouse onboarding team.

John profile

John deRoulet

Sr. Director of Revenue Management Education

John deRoulet (JDR) is an expert revenue manager and sought after revenue strategist.

author image

Andrew Kitchell

CEO & Founder

Andrew Kitchell is CEO and Founder at Wheelhouse, a revenue management platform that serves the leading professional operators in the vacation rental, short-term, corporate rental & boutique hotel space. 

Join the next generation of revenue managers

In minutes you can create your strategy and preview pricing across your calendar.