In our prior chapter, we discussed how to identify opportunities to earn more revenue. In this chapter, we will discuss how to make precise updates to specific time ranges, made as stay dates approach. At Wheelhouse, we call these adjustments or interventions.
And, while knowing when & where to intervene is non-trivial, knowing how much to intervene - specifically how much to increase or reduce any aspect of your revenue strategy - is undoubtedly one of the hardest aspects of revenue management.
Unfortunately, no amount of data, research, or knowledge can offer definitive answers as to how you should adjust a strategy in order to maximize revenue. This is because a wide variety of evolving variables (market conditions, events, weather, etc.) will keep even the most strategically sound teams on their toes, as they try to optimize revenue.
Therefore, with perfection an impossibility, the goal of a sound intervention strategy is to make better decisions, more often - knowing at some point you need to lock in your best decisions and then stay ready to re-assess your strategy as more data emerges.
In this chapter, we'll discuss how to best structure your interventions in order to drive learnings and more revenue from your efforts.
3.1 Intervene: Developing Strategic Guidelines
The first step we recommend in developing an intervention approach is to establish strategic guidelines (or mantras!) that form the foundation of a consistent, logical decision-making process.
The goal of creating these guidelines is to describe standard approaches that you want to take given a set of conditions.
Creating these strategic guidelines will accelerate your ability to make decisions, while also providing clarity to other stakeholders before, during, and after any critical performance period.
OR "The market rates drop within 14 days and we discount to stay competitive"
OR "We want to prioritize occupancy and 'heads in beds' and thus discount heavily in the short booking window to undercut the competition."
ADR Guidelines: "We want to maximize ADRs in the primary booking window by staying slightly above market. This is because we are confident in our ability to sell more rooms as stay dates approach, should that be necessary."
OR "Our properties are higher quality, so we want to maintain a higher rate position in the prime booking window."
Next Year / Occupancy Guidelines: "We expect next year is going to be competitive, and therefore plan to undercut the market before the prime booking window, in order to build a strong base of bookings early."
OR "We expect supply increases and constrained demand to cause next year to be difficult and will keep prices below market comps unless occupancy pace is significantly higher year-over-year. We will check this occupancy pacing at least every [14 days]."
Additional Intervention Guidelines:
While there are many guidelines you could document, here are some more examples that, should you define them for you & your team, will give you an excellent foundation:
Peak Season Guidelines (e.g., "During identified peak periods, we maintain rates at 10-15% above market average, adjusting only if occupancy pace falls below 75% of last year's booking curve, checked weekly.")
Lead Time Guidelines (e.g., "For bookings more than 60 days out, we evaluate pricing every 10 days based on pace-to-target metrics, increasing rates by 5-8% when exceeding previous year's booking pace by 15% or more.")
Large Event Guidelines (e.g., "For high-demand events (conferences, festivals, sports), we establish premium pricing 90+ days out and hold firm until 30 days prior, when we reassess based on remaining inventory and competitive positioning.")
Shoulder Season Guidelines (e.g., "During shoulder seasons, we prioritize occupancy by positioning 5-7% below market average until reaching 50% occupancy, then gradually increase to market parity as demand materializes.")
Weekday vs. Weekend Guidelines (e.g., "We maintain a consistent 15-25% rate premium for Friday/Saturday stays versus midweek, narrowing this gap only when midweek occupancy exceeds 80% of capacity 30+ days out.")
Length-of-Stay Guidelines (e.g., "We implement minimum stay requirements of 3-5 nights during peak seasons and high-demand periods, reducing to 2 nights for midweek arrivals.")
Gap Night Pricing Guidelines (e.g., "For single-night gaps between bookings ('orphan nights'), we offer a 15-20% discount when stay dates are less than 14 days out, increasing to 25-30% discount within 7 days.")
Strategic Guidelines are not meant to tell you or your team exactly what to do.
However, when you identify a change you'd like to make, you can utilize guidelines like these to "check" your decisions for alignment with your overall strategy.
Importantly, if you consistently find you are making interventions which do not align with your guidelines, it indicates that it is time to review your strategy, re-assess market data holistically, and likely discuss or communicate a change in strategy to your stakeholders.
Leveraging these frameworks can ensure alignment between the strategic and tactical levels (e.g., updating properties) of a scalable, high-functioning revenue management practice.
3.2 Introducing the Intervention Matrix
With your strategic guidelines established, you can now develop decision matrices to help your team make faster, aligned strategic decisions. At Wheelhouse, we call these intervention matrices.
Basic Intervention Matrix
The basic intervention matrix provides clear guidance on how to act based on your performance versus a trusted benchmark. This framework uses two primary KPIs—Occupancy and ADR—to compare your current performance against either:
Historical Performance (ideally using Same Time Last Year data)
Market or Competitive Set Performance
This approach creates a straightforward framework for making strategic interventions:
Occupancy Higher, ADR Lower
This indicates your property is attracting bookings but not capturing optimal revenue per booking. The property is pacing well in demand but failing to achieve fair market ADR.
Intervention: Increase Rate Positions
Occupancy Higher, ADR Higher
This signals exceptionally strong demand for this period, suggesting the upper rate ceiling remains untested. Often tied to specific high-demand events, these conditions typically apply to limited date ranges rather than broader periods.
Intervention: Increase Rate Positions
Occupancy Lower, ADR Higher
This pattern suggests your rates may be positioned too high for current market conditions, deterring bookings. The property is pacing poorly, most likely due to rate positioning above market tolerance.
Intervention: Decrease Rate Positions
Occupancy Lower, ADR Lower
This represents concerning performance—both pace and rates are underperforming despite already reduced pricing. While further rate reduction is the immediate response, the root cause may extend beyond pricing to distribution strategy or property appeal issues.
Intervention: Decrease Rate Positions, while investigating non-pricing factors
But wait, there's more!
The Occupancy Higher, ADR Lower quadrant typically suggests increasing your rate positions.
However, this recommendation might conflict with your strategic guidelines. For example, if your strategy this year explicitly aims to "Lower rates to increase the booking window," maintaining your current pricing approach would be the appropriate action despite what the matrix suggests.
You might also have insights from historical performance indicating that last year's booking window was compressed due to overpricing. In this case, your current "lower ADR" position might be an intentional strategy to build occupancy earlier, deliberately pacing ahead of market by accepting a lower rate position.
Context is crucial in revenue management decisions. This example highlights why documenting clear strategic guidelines is crucial—particularly for teams with multiple stakeholders.
Therefore, when strategic intentions are established early, the team can make consistent decisions even when standard frameworks suggest different actions.
Understanding Historical Data Limitations
Any significant adjustments to overall strategies—or even changes to the Revenue Management team—need to be considered when analyzing Same Time Last Year (STLY) data.
For example, if a previous team or team member maintained artificially high rates but then heavily discounted them at the last minute, this practice would create misleadingly shorter lead times in your historical data.
Therefore, when leveraging your own historical data for comparative analyses, recognize that even your own data can provide an incomplete picture against which to strategize. Always consider the context behind the numbers and account for changes in strategy, personnel, or market conditions when making year-over-year comparisons.
3.3 Expanding Your Intervention Matrices
In the basic matrix example above, the Occupancy Higher, ADR Lower quadrant generally advises you to increase your rate positions.
However, if your strategic guideline this year was to "Lower rates to increase the booking window," then you may decide to make no intervention.
Therefore, our simple frameworks can—and must—be expanded to incorporate different scenarios.
Lead Times
A good rule of thumb is, "the closer the stay date, the riskier it is to push for higher ADR." Ideally, you make decisions to push rates early in a booking window.
As we discussed in Chapter 1: Foundation, your booking window can differ dramatically depending on the location, size of property, and season.
You will need to determine—based on your risk tolerance and the booking patterns for your specific properties—when you are "too close to the stay date" to push rate.
Advanced Matrices: Develop matrices for specific lead times (e.g., 60+ days out from stay date || Portfolio has higher occupancy, lower ADR)
Portfolio Expansion or Changes
Understanding how inventory changes affect Same Time Last Year (STLY) comparisons is crucial.
If one type of inventory within your portfolio has grown significantly (i.e., your team has acquired a significant number of 4+ bedroom listings), then you can expect changes in both ADR and occupancy metrics from year to year.
Advanced Matrices: Develop matrices for specific inventory types (e.g., 2-bedroom listings || Portfolio has higher occupancy, lower ADR)
Recent Performance or Macro Conditions
Having a sense of how the market (or markets) is behaving currently will influence your risk tolerance and decision-making.
Being aware of your general pacing—not just your current occupancy and ADR—can be a critical input to understanding how travelers are currently responding to economic or other conditions.
Advanced Matrices: Develop matrices for recent pacing (e.g., pacing well in last 14 days || Portfolio has higher occupancy, lower ADR)
Events
Events are a major driver of booking patterns. Annual events are generally easier to predict; however, holidays might shift to different days of the week, or an event might experience a significant increase/decrease in demand for various reasons.
Given how important events are to your revenue performance (and owner reporting), it will likely serve you well to provide guidance to stakeholders about how you intend to handle large, meaningful events from a strategic perspective.
Advanced Matrices: Develop matrices for specific large events (e.g., for X, Y, and Z events || Portfolio has higher occupancy, lower ADR)
3.4 Rate Adjustment Methodologies: From Basic to Advanced
When you've made the decision to intervene, determining how much to adjust rates blends both art and science.
For example, when an opportunity to increase rates has been detected, by how much should you increase them? 10%? 25%? 100%?
There is no perfect answer to this question.
In practice, revenue managers develop their optimal approach to interventions based partly on their own risk tolerance. More advanced RM teams develop approaches that allow for more granular responses, considering factors such as booking window, property type, and location.
Approach #1: Incremental Interventions
The most basic approach is to make small, well-documented adjustments and measure the results.
For example, if you've identified an "Occupancy Higher/ADR Higher" date range in a group of properties, a straightforward approach might be to:
Implement an additional 10% rate increase
Allow that to sit and sell in the market for 1-2 weeks
Evaluate if you're still in the "Occupancy Higher/ADR Higher" position and if the property group has continued to sell room-nights since your last change
Depending on the outcome, implement an additional rate change or maintain your current strategy
Don't forget to verify your position in the booking window, as you may be within what you consider a "high-risk" timeframe and might decide to hold your rate instead of increasing it.
When first using this approach, we recommend making changes in the 5-10% range and reassessing the impact weekly.
Approach #2: Listing-Level Pacing Interventions
Another effective method is to build Pacing or Performance Tables. These tables create a framework for precisely modifying your pricing strategy based on each listing's current performance.
In most cases, performance is measured on two axes:
Occupancy for a time range
Days from Stay Date
In these tables, each cell value dictates how you respond to a given set of conditions. For example, your table would help you answer: "If this listing is 50%-75% booked 100 days before the stay date, increase rates by 25%."
While these tables typically focus on occupancy performance, you could also create tables for:
Pacing relative to Revenue
Pacing relative to Budget
Pacing relative to CompSet Pacing
Pacing relative to STLY Occupancy Pacing
Developing these tables helps you quickly adjust your pricing strategy. Additionally, tools like Wheelhouse enable you to automate these actions, allowing your team to tightly control your strategy in real time.
Approach #3: Group-Level Pacing Interventions
If you have similar inventory, these tables can be built at the group level.
Your portfolio could automatically adjust based on group performance. For example: "If 50%+ of listings are booked 100 days out, increase prices for ALL AVAILABLE listings by 25%."
In the hotel world, pacing by group performance is extremely common, partly because all rooms at a hotel have a shared owner and standardized room types.
In the vacation/short-term rental world, this is rarely the case, as each listing is unique and often individually owned.
For example, when analyzing Weekly Occupancy for 4-Bedroom listings, you might identify several weeks as candidates for interventions and leverage a similar pacing matrix (e.g., 30 days out, 30% occupied = X% reduction in prices)
Approach #4: Point-Driven Interventions
Your team might want to create a point-driven system for making specific interventions.
In this system, your team would align on various variables that could contribute to a more precise recommendation (e.g., "immediately increase 28%" vs. "increase 10%").
For example, your team could develop a system such as:
Increase prices for a time range/set of listings:
+2.5% if the listing is pacing 5% AHEAD of STLY for a time period
+5% if the listing is pacing 10% AHEAD of STLY for a time period
+5% if your CompSet is also pacing AHEAD of STLY for a time period
+5% if your Market is also pacing AHEAD of STLY for a time period
+5% if good market conditions exist AND a specific property has a unique/luxury offering
+3% if the owner of this property is risk-forward
+10% if you are still 30 days out and have exceeded last year's monthly revenue
Decrease prices for a time range/set of listings:
-10% if less than 30 days out
-10% if no bookings for the last 14 days
-5% if 1+ recent poor reviews
These kinds of automations or triggers represent an advanced implementation of a revenue management strategy. Only teams with strong guidelines and a good handle on their data and performance will be positioned to implement these as automations.
Consistency vs. Perfection
As discussed, adjusting rates is an imperfect science.
Revenue Management Systems like Wheelhouse must acknowledge that every recommendation we make is always a "best guess" at how to adjust your specific property's pricing, based on a huge number of variables and evolving market conditions.
From a principled revenue management perspective, the approaches detailed above aim to make consistent changes, track those changes, and follow up to measure if your adjustments altered your pacing or revenue success. This systematic approach to testing and learning is what separates strategic revenue management from arbitrary price changes.
3.5 A Complete Intervention Toolkit
Changing rates is the most common intervention that revenue managers make. However, many aspects of your revenue strategy can be adjusted to drive bookings, occupancy, or revenue.
Types of Strategic Interventions
Minimum Length of Stay (MLoS): Setting requirements for the minimum number of nights guests must book
Closed to Arrival restrictions: Blocking check-ins on specific dates
Closed to Departure restrictions: Blocking check-outs on specific dates
Length of Stay Discounts: Offering price reductions for longer stays
OTA mark-ups: Adjusting pricing on Online Travel Agencies to control channel costs
OTA promotions: Participating in platform-specific promotional opportunities
Marketing discounts, coupons and promotions: Creating direct booking incentives
Fees: Adjusting cleaning fees, service charges, or other additional costs
Capturing vs. Generating Demand
The right intervention is almost always tied to understanding market conditions and the competitive landscape.
For example, if you know your market or competitors are booking—but you are not—you will want to adjust aspects of your strategy that impact conversion.
However, if neither your properties nor the market is booking, you will want to focus on approaches that generate demand.
Strategies to Capturing Demand:
Reducing Minimum Length of Stay
Removing Check-in/Checkout Restrictions
Reducing Fees
Relaxing Cancellation Policies
Strategies to Generate Demand:
Increasing Marketing Efforts
Participating in OTA promotions
Implementing Strategic Discounting
These approaches give you—as the revenue manager—tools to leverage without altering base prices.
Considerations for Non-Price Interventions
It's important to note that many of these adjustments indirectly impact the final price a customer pays.
For example, requiring 3 nights instead of 2 nights increases the total price a consumer must pay and limits potential guests based on their budget or travel schedule.
An additional risk to consider is that your restrictions may impact potential demand in ways not visible to the revenue manager. While it may seem straightforward to increase a minimum length of stay from 3 nights to 4 nights to increase revenue by approximately 30%, it's often difficult to quantify how many travelers are searching for 3-night stays—searches that would no longer return your property.
Furthermore, revenue managers should be particularly intentional with restriction-based interventions and ensure they align with your general strategy. These changes typically offer less visibility into their potential impact compared to rate adjustments, where you can directly compare competitor rates and observe booking patterns.
3.6 Tracking & Applying Interventions
In practice, interventions are the tactical aspect of revenue management, derived from the strategic work you developed with your mantras & matrices.
In making these tactical adjustments, you want to be sure to document your work, in order to build a track record of times you implemented - or deviated from - your initial strategy.
Documenting an Intervention
The step for implementing interventions follows these steps:
Identify the Date Ranges for Optimization
Identify the Listings for Optimization
Implement an Intervention (Example: +10% or -10% to the rate)
Set a Reminder or Follow-up Date
Identifying date ranges for optimization is the primary component covered in our "Identify" chapter.
We wanted to reference it here as step 2 illustrates that at the time of any intervention, you will often want to make more granular decisions about which listings to include or exclude in an intervention.
While you can apply interventions uniformly across individual properties or groups, this stage offers an opportunity for fine-tuning. Comparing availability to other units or referencing data points such as recent room night sales, reservation patterns, or upcoming occupancy can enable more targeted interventions.
Real-World Example
When identifying time periods for optimization, you identifies that the first week in October is selling ahead of pace and could support a higher rate position for your 2-bedroom properties.
However, after reviewing the metrics & tape chart, you observe that while most 2-bedroom units are selling well, a few properties have very low occupancy, haven't sold for any dates recently, or have consistently lower occupancy rates compared to other units.
Therefore, when implementing the intervention, you may wisely decide to exclude these underperforming listings from the rate increase. This decision recognizes that while the overall property group is selling well, these individual units demonstrate different or even opposing trends that require a customized approach.
This level of granularity in decision-making illustrates how you can (and should!) balance group-level strategies with property-specific performance data.
Interventions vs. Strategic Revisions
Individual interventions serve as surgical tools—limited in scope, highly targeted, and responsive to the specific KPIs you've identified as significant.
However, when you find yourself repeatedly applying similar interventions to the same inventory, this pattern may signal the need to recalibrate your foundational rate strategy, rather than continuing with tactical corrections.
3.8 Measuring Intervention Success
To measure the success of these interventions, it's critical to track interventions in a structured and consistent fashion.
This means recording not just the what (e.g., "Dropped rates by 10%") but the why, when, and where. What problem were you trying to solve? When was the change made and for which segments or room types? Without this context, it becomes nearly impossible to evaluate cause and effect during a portfolio performance review.
One effective method is to maintain notes about your pricing interventions. This can be as simple as a shared spreadsheet or a more sophisticated tool integrated with—or even within—your RMS.
While your approach will be unique, a robust set of criteria for your entries should include:
The date of the intervention
The specific action taken
The rationale behind it (e.g., "soft pickup 14 days out")
The channel(s) impacted
And ideally, the following week, a short-term outcome review (e.g., "+8% pickup in 3 days post-adjustment").
By reviewing this log regularly, you can begin to see patterns—what types of changes work under what conditions, and which tactics might not be worth repeating.
During monthly or quarterly portfolio reviews, this log becomes an invaluable tool (more about this in Chapter 5!). Instead of guessing why a certain period under- or over-performed, you will be able to quickly reference a timeline of interventions to better understand performance drivers. This transparency not only improves decision-making but also supports communication with stakeholders like owners, GMs, or asset managers.
Over time, this discipline will help you evolve from a reactive to a strategic approach—learning from past actions to improve future forecasts and pricing strategies.
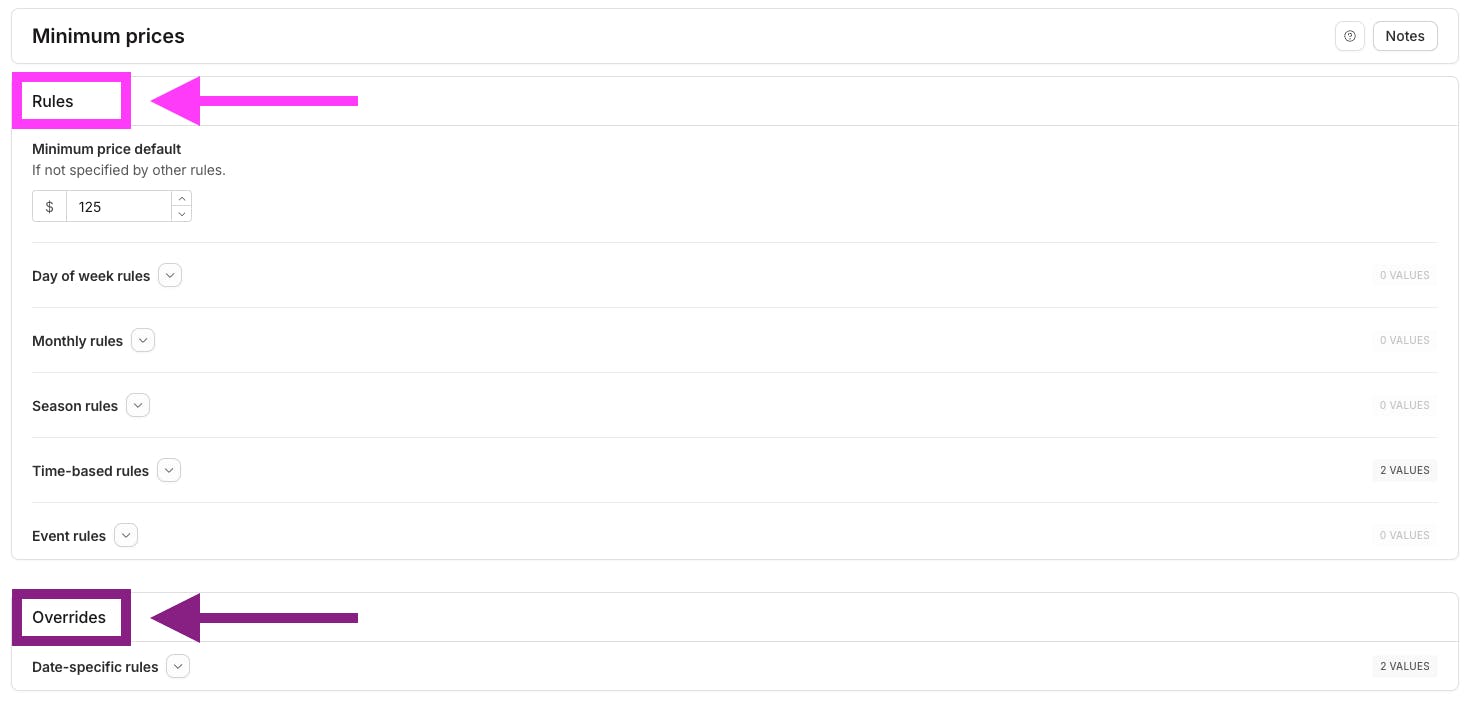
"Rules" vs. "Overrides"
On Wheelhouse, each setting allows you to easily manage:
Your rules - the optimal strategy you build at the start of a season, year, or time range
Your overrides - the changes you make in strategy as stay dates approach
While seemingly subtle, by separating rules from overrides, you and your team can much more easily:
Create your best initial strategy (rules)
Adjust your strategy as patterns develop (overrides)
Study and examine the successes or shortcomings of your strategy at season end (performance analysis)
Additionally, all of these rules/adjustments - as well as all calendar days - can be supplemented with notes, making it easy to document your pricing interventions directly within your RMS.
Wheelhouse also provides an intuitive change log that tracks every single modification made by either you or the system.
If you're planning to scale your revenue management practice, you'll want to leverage an approach or an RMS that offers these capabilities. This structured approach to separating your strategy (rules) from tactical adjustments (overrides) creates a clearer picture of what's working and why, enabling continuous improvement of your revenue management processes.
Conclusion
Well done! You just took the time to greatly amplify your revenue management skills.
In this chapter you covered key components, including:
Foundation: How to establish clear guidelines that align tactical decisions with your broader strategy, creating consistency across your team.
Framework: How to create intervention matrices that transform complex market signals into clear action plans, accounting for variables like lead times, portfolio changes, and events.
Methodology: How to ochoose the right intervention approach—from simple incremental adjustments to sophisticated point-driven systems—based on your portfolio and capabilities.
Process: How to implement changes systematically and track them meticulously, documenting not just what was changed but why, when, and where, turning tactical decisions into strategic insights.
While at first this may seem daunting, we have seen that this structured approach dramatically increases your success rate by enabling consistent, data-driven decisions. In time, it will even reduce your workload (as well as indecision, stress, and difficult conversations!) as you continue to refine and communicate your strategy and interventions.
And... speaking of communicating strategy, that is the focus of our next chapter, where we'll leverage all the we've learned to better align your teammates and stakeholders.
John deRoulet (JDR) is an expert revenue manager and sought after revenue strategist.
Kegan Mulholland
Revenue Manager and Head of Onboarding at Wheelhouse
Kegan is a seasoned Revenue Manager and heads the Wheelhouse onboarding team.
Andrew Kitchell
CEO & Founder
Andrew Kitchell is CEO and Founder at Wheelhouse, a revenue management platform that serves the leading professional operators in the vacation rental, short-term, corporate rental & boutique hotel space.